The Pattern: Identifying Requests and Responses in Encrypted Traffic
Published September 2, 2024
Introduction
Advances in cybersecurity frequently mean that it’s harder to troubleshoot issues. Some security solutions add a lot of complexity to a system, and sometimes the fact that traffic is encrypted means we can’t see everything we want to.
When analyzing traffic in Wireshark, identifying requests and responses are key to understanding how two computers are interacting with each other over the network. Figuring out what the request and response sizes are is also important to figure out what particular network setting to look at. For example, looking at congestion and receive window settings are important for large file downloads, but those don’t make much of a difference when the request is GET /favicon.
When network analysts have the ability of analyzing decrypted traffic, Wireshark does a fantastic job of showing where requests and responses start and end, as well as how large those objects are. But when the traffic is encrypted, the analysts need to be better tuned into how that traffic flows.
What does a Request Look Like?
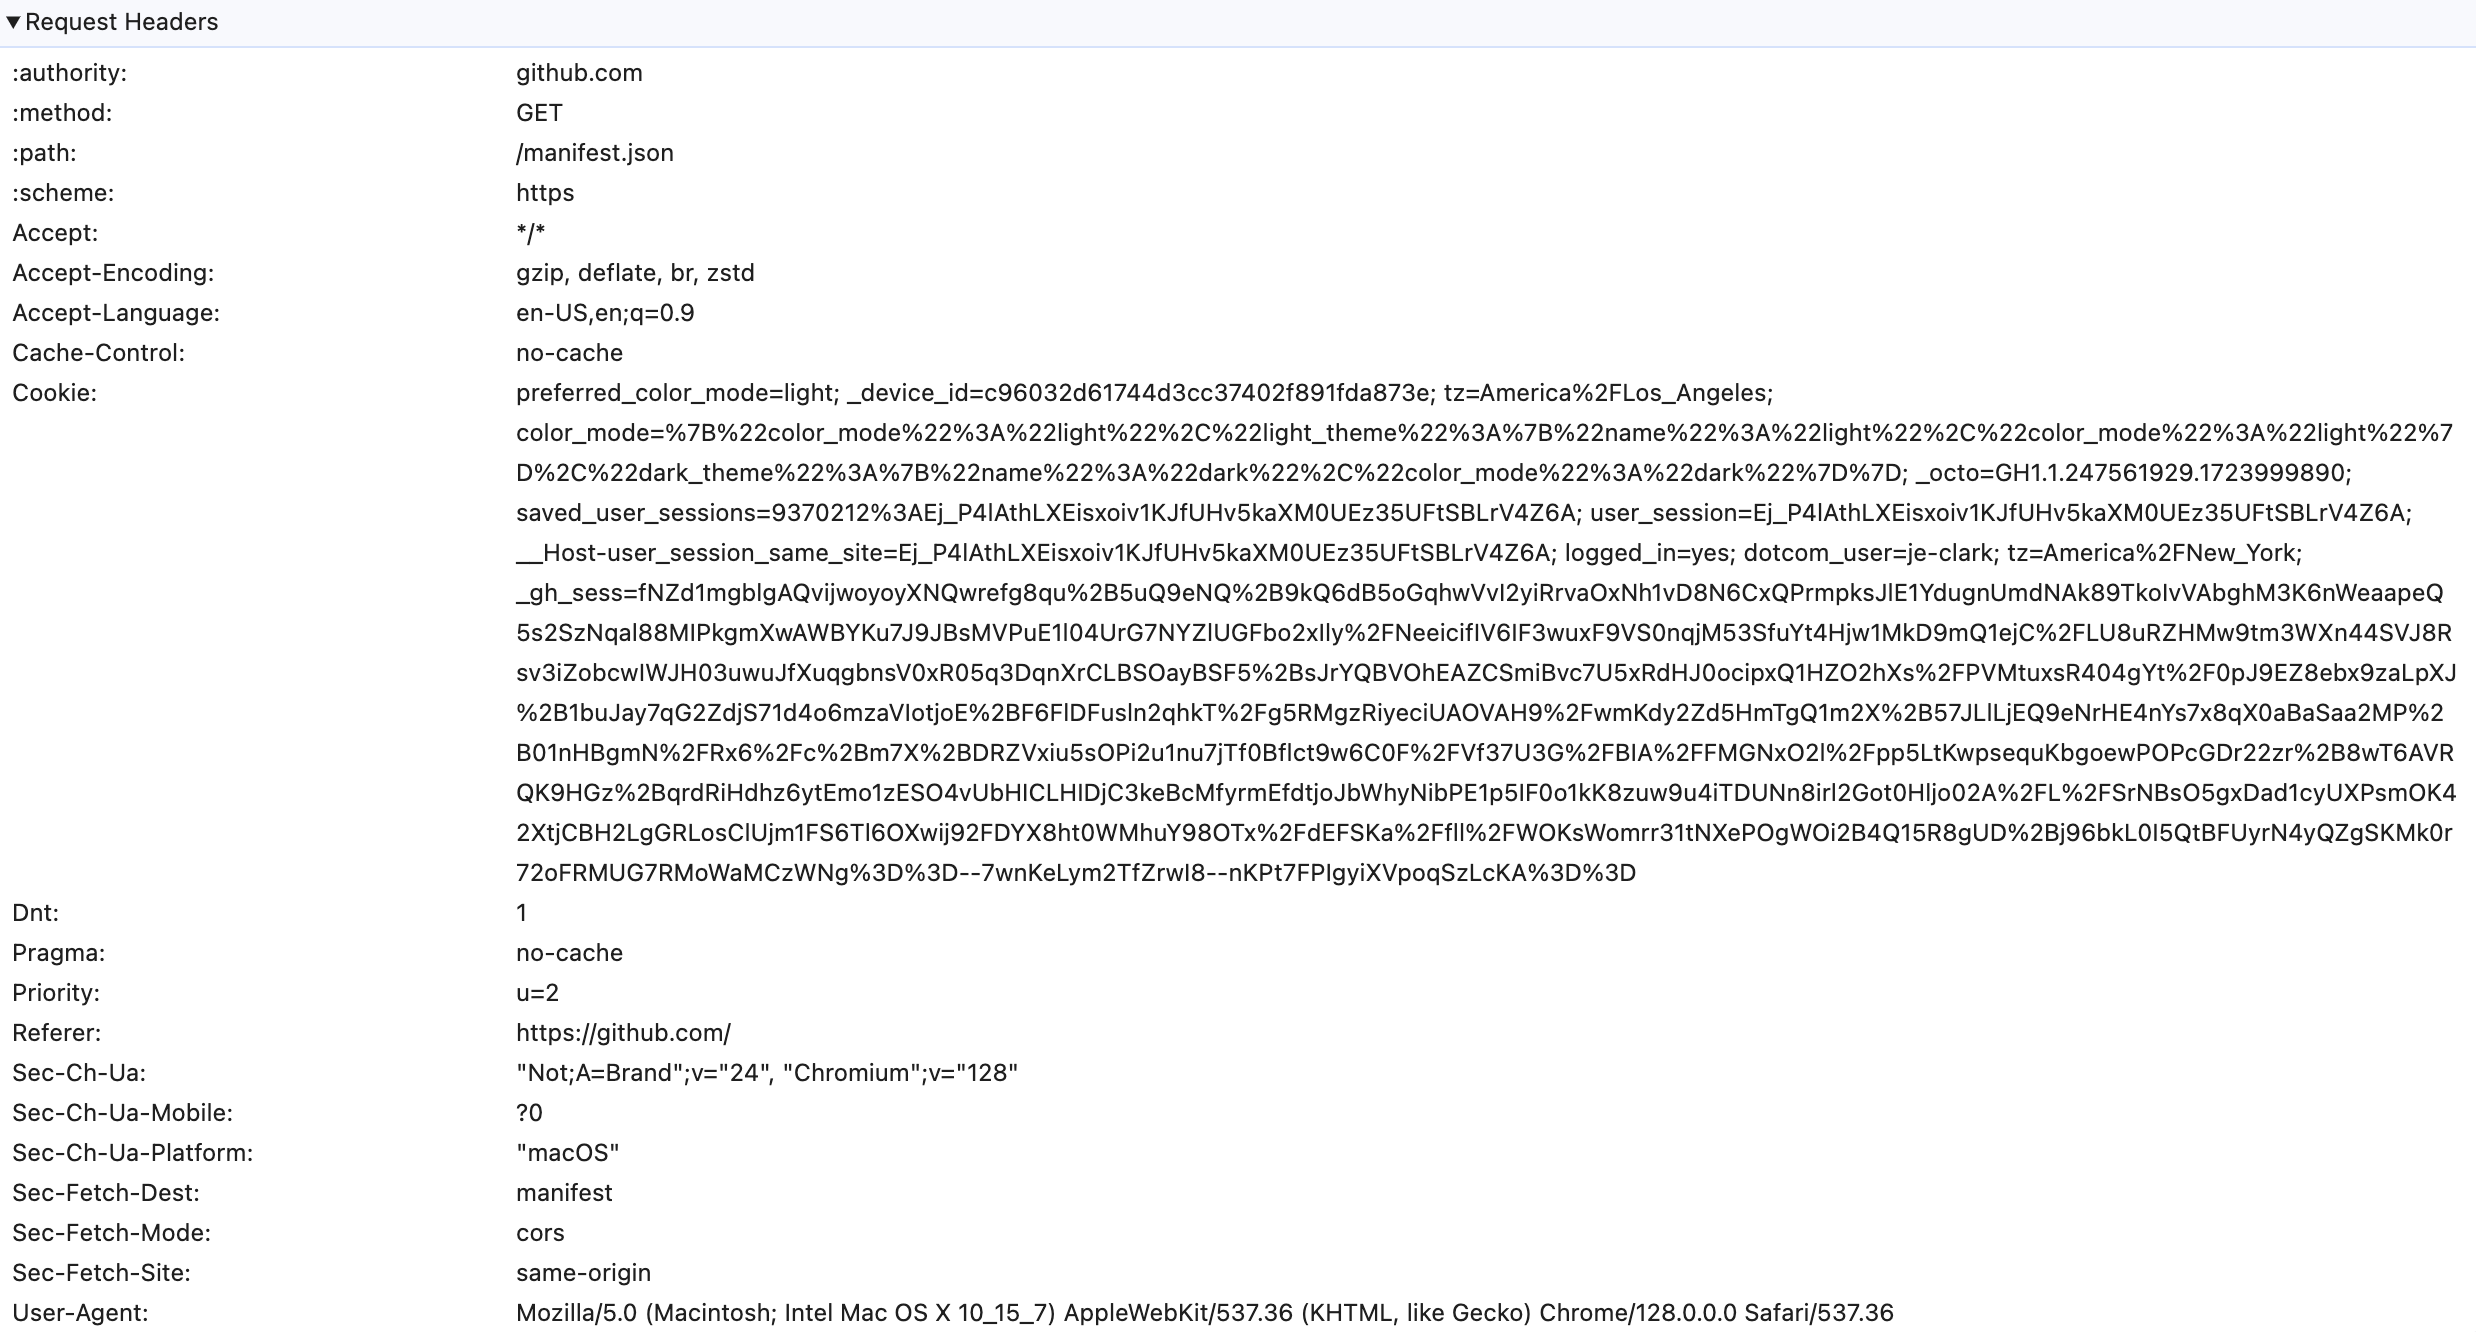
Pull up dev tools on your browser and navigate to any modern website. Take a look at how many cookies and HTTP headers get added to your requests. Between session keys, load balancer tokens, authentication cookies, and whatever else the site adds in, requests have become massive.

And that’s an opportunity. The most common Maximum Segment Size (MSS) on the internet is 1460 bytes. So any request that has more than 1.4 KB of data in it needs to be split into multiple packets.
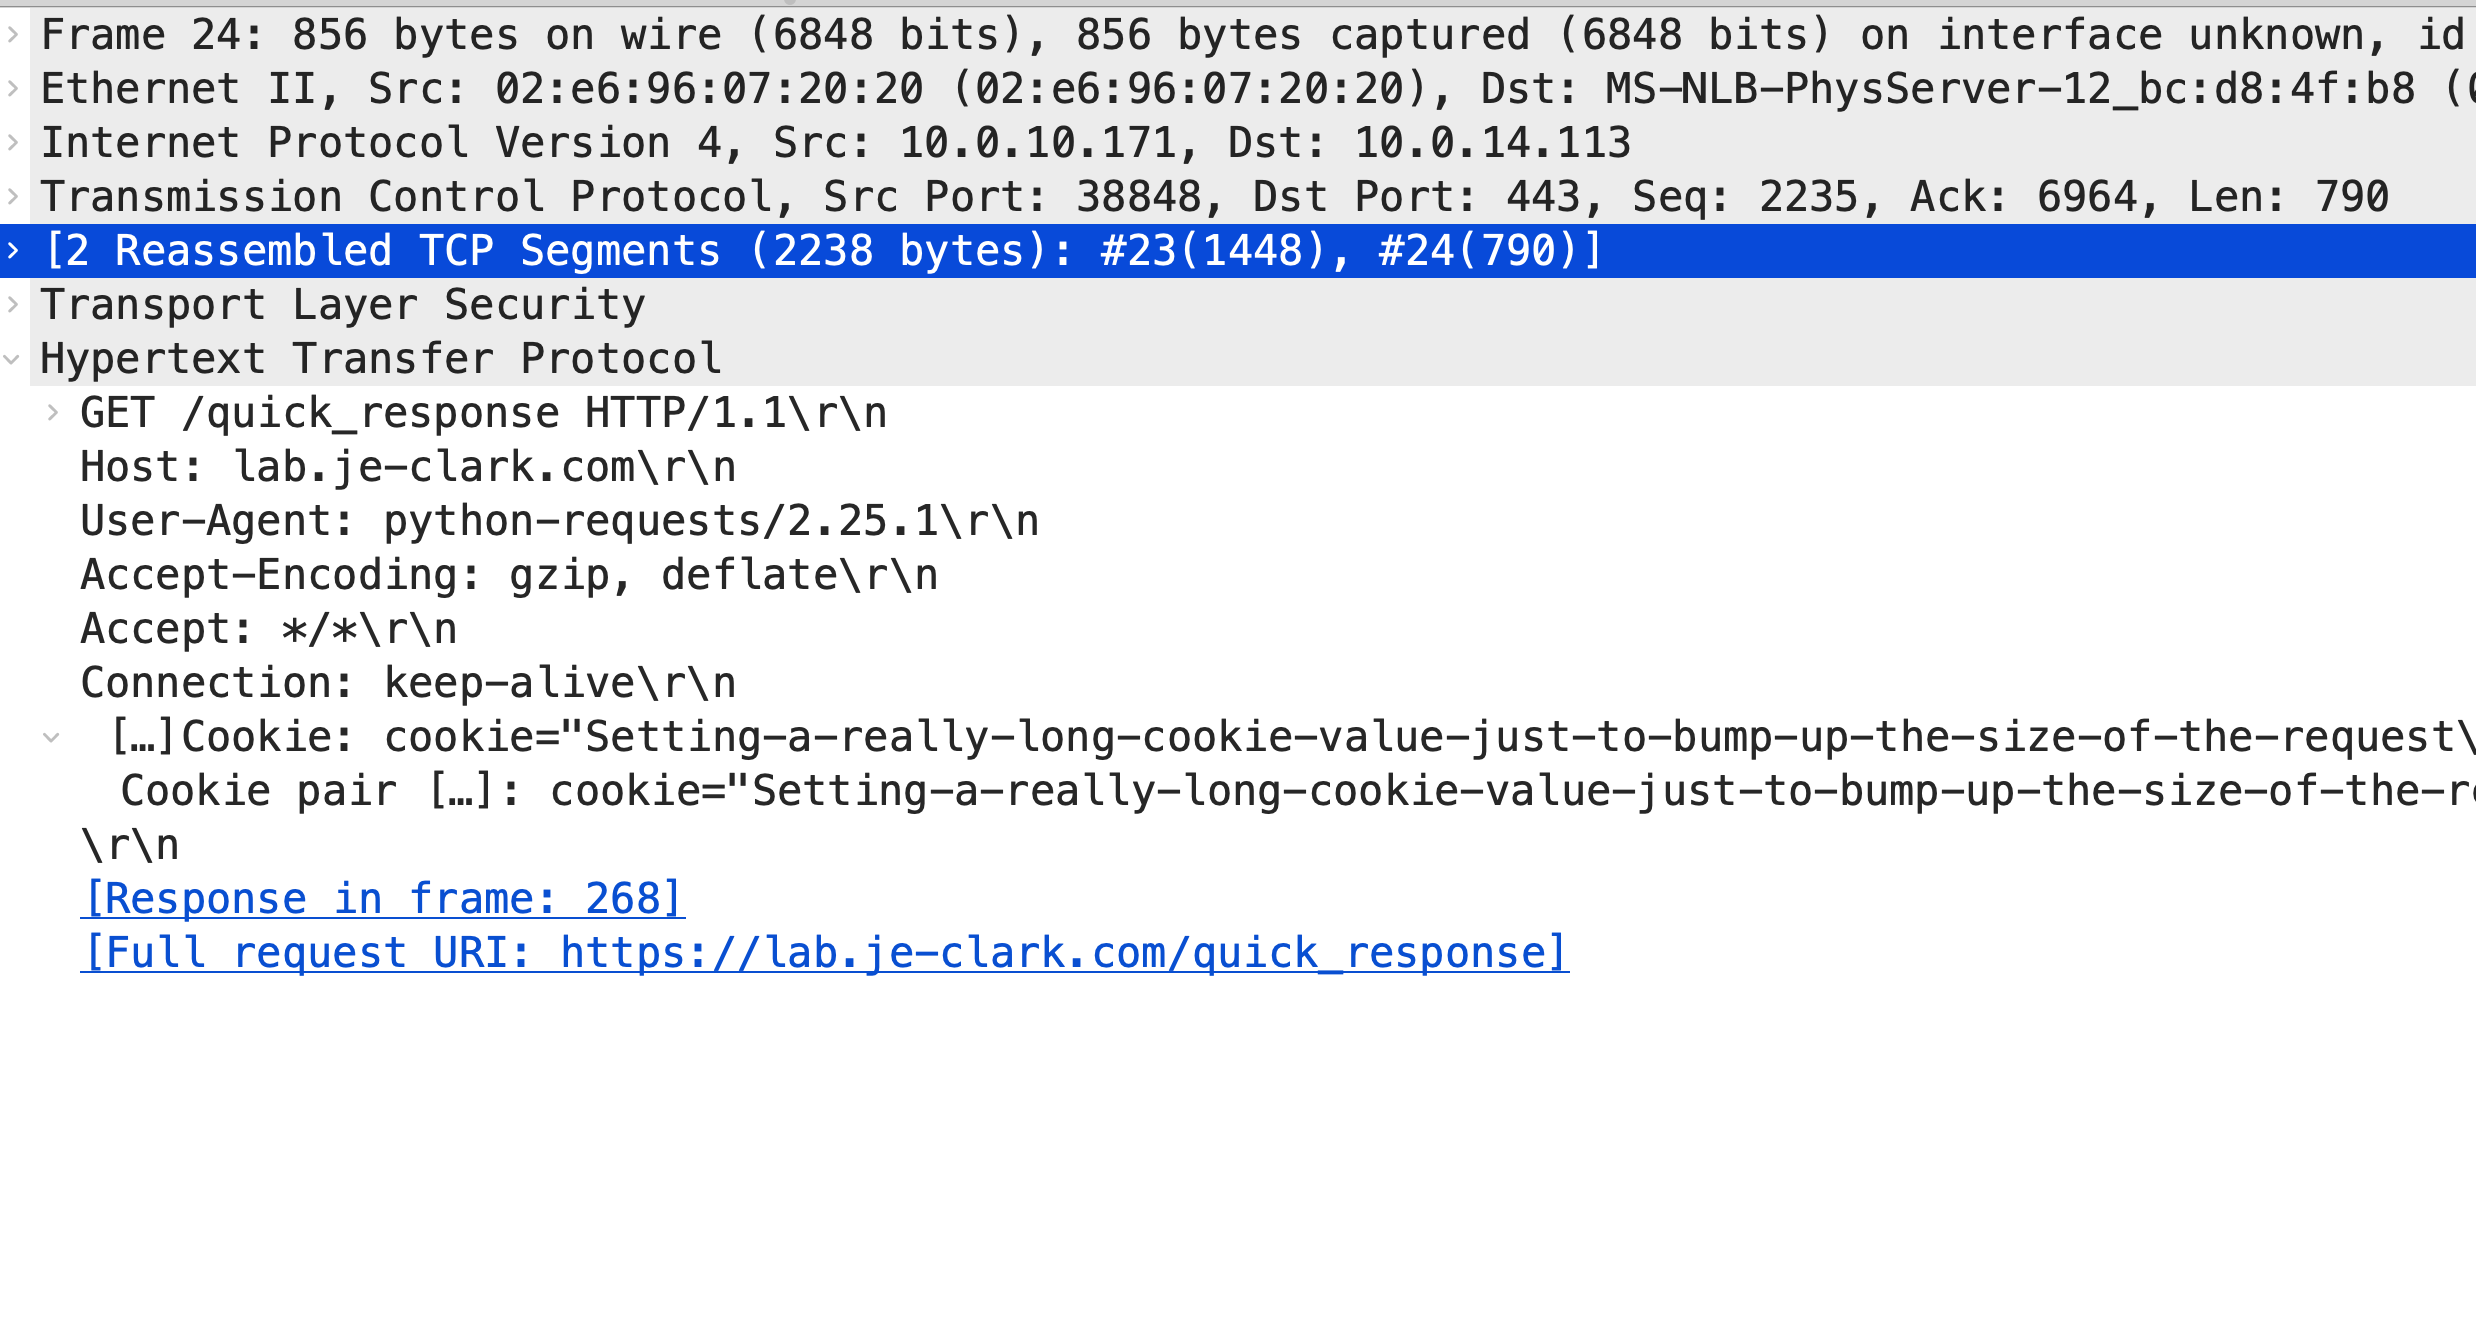
If we look at a decrypted request in Wireshark, we can see that the request is split into multiple packets, and they tend to be marked as TCP packets until the entire request is put together in the final packet. But take a look at the sizes of each of those packets (I tend to use tcp.len instead of frame.length because I usually care about payload sizes more than full frame sizes).

Every single one of those packets in the request labeled TCP is the full size, or 1460 bytes. The last one that’s labeled HTTP is the only one that’s smaller than 1460. This is an incredibly consistent pattern that appears, and it’s one that’s supported by statistics. After all, what are the odds that a request size just happens to be a perfect multiple of 1460? In this screenshot, frames 23 and 24 both make up a single HTTP request

Let’s also look at the TCP flags - I highly recommend creating a column that shows tcp.flags.string to make this easier. Every single one of those full size packets has the ACK bit set, but nothing else. It’s only that last packet, the shorter one, that has the PSH flag set.
This happens because of the TCP standard: the PSH bit is a signal to the receiver that the message is complete and it shouldn’t wait for any more data before pushing the message up to the application.
So now we have multiple signals that don’t rely on Wireshark telling you what packets make up an HTTP request:
- There will be one or more full-MSS packets followed by a shorter packet
- That shorter packet will have the PSH bit set
Does a Response Look any Different?
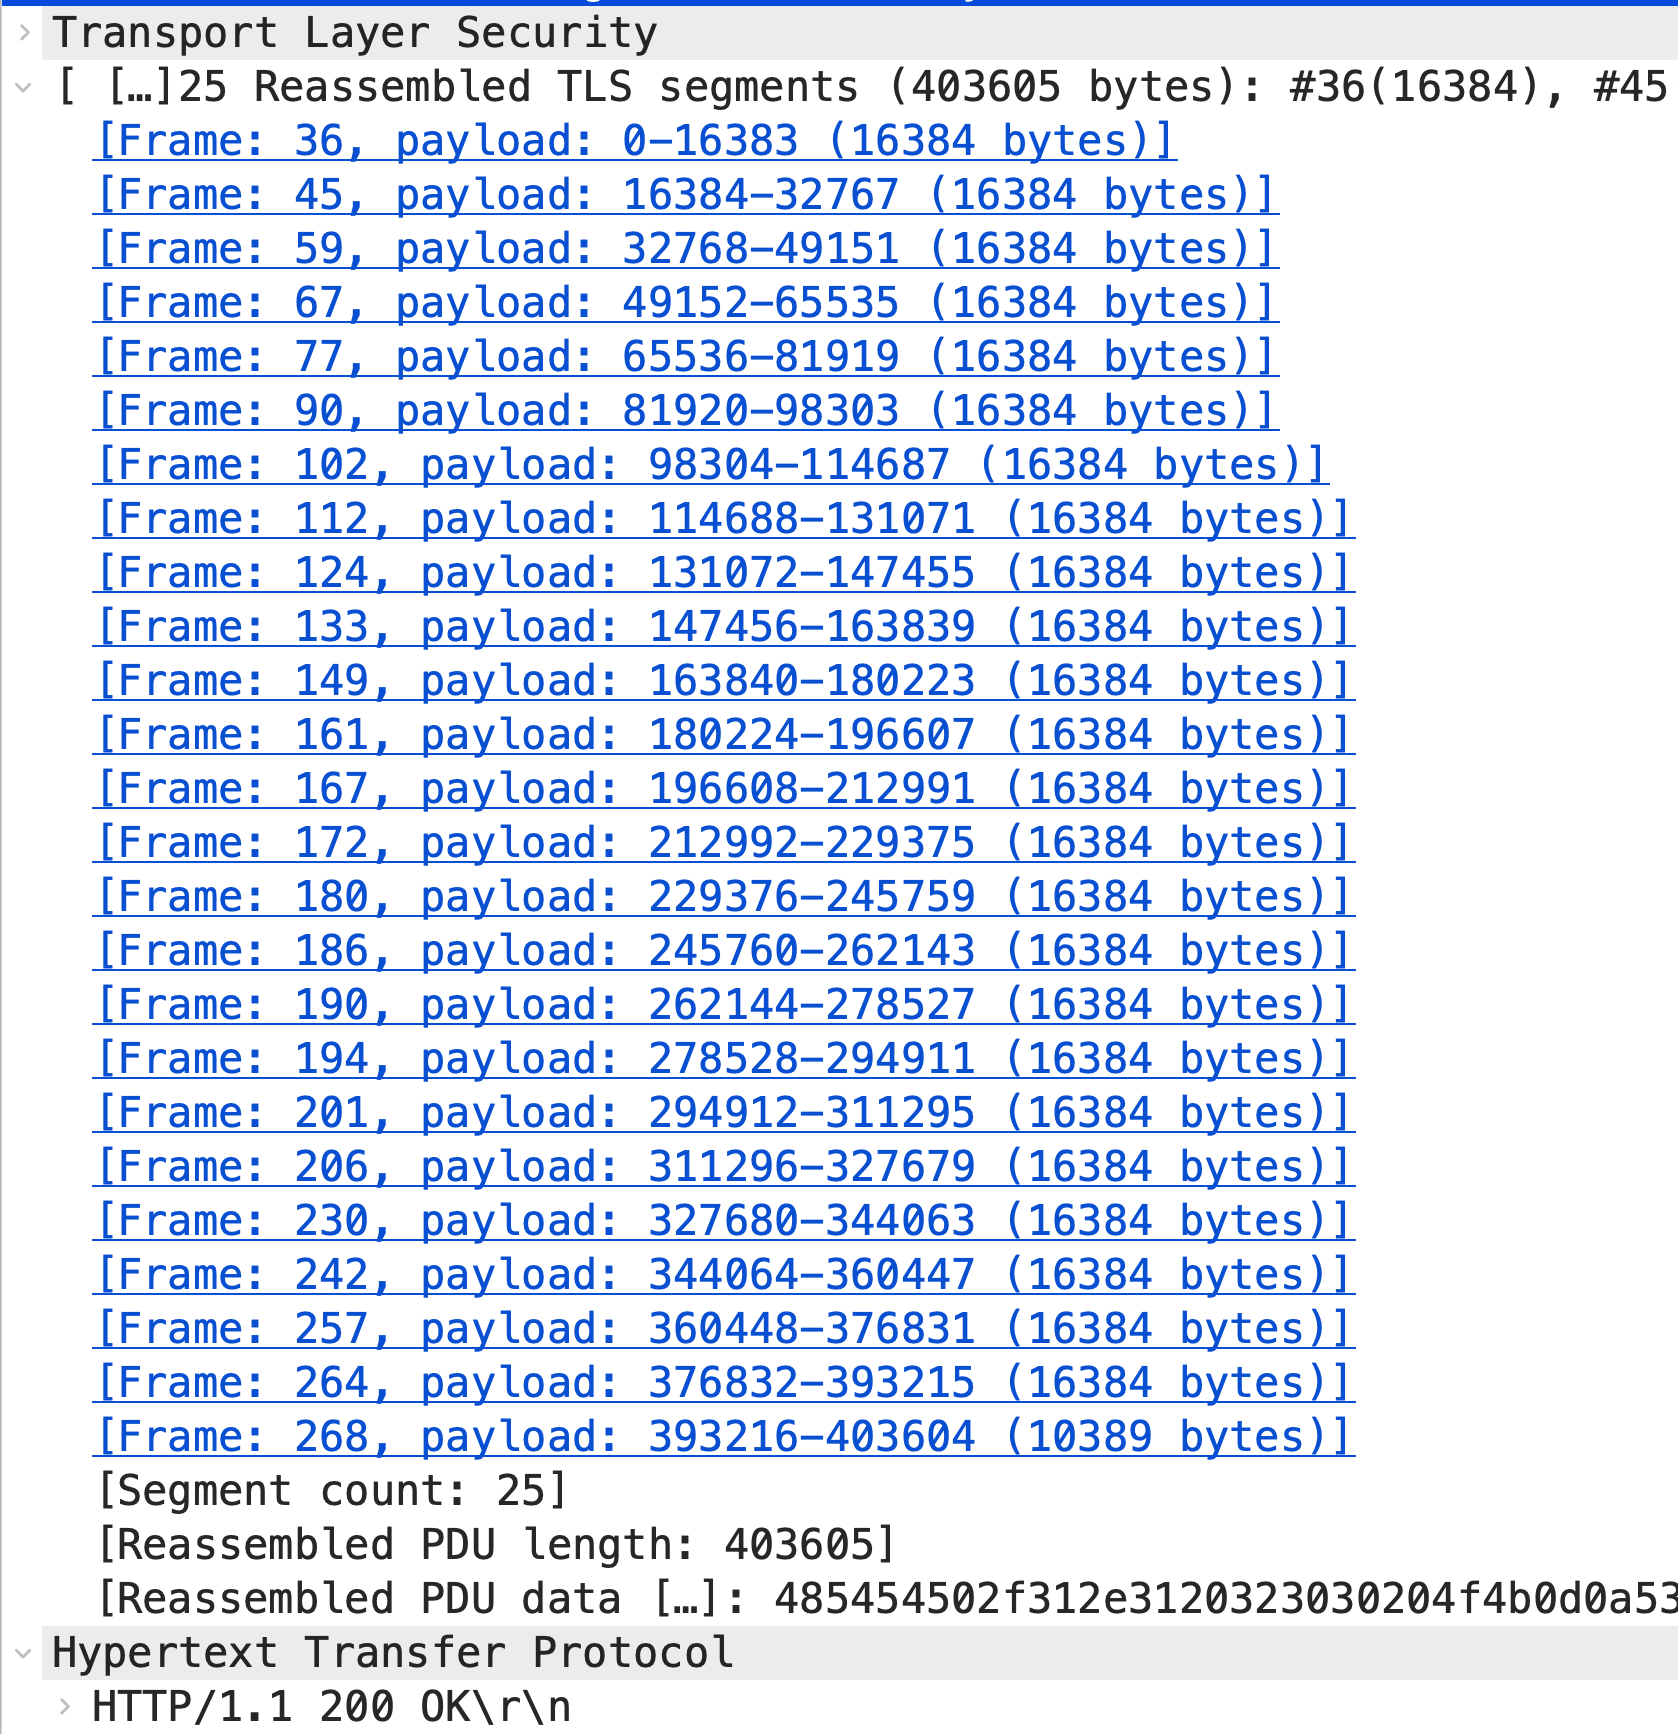
Let’s look at a decrypted response. The only real difference is that responses tend to be longer than requests, so there are more full-MSS packets to scroll through before hitting the shorter packet at the end.


What Happens Between the Request and Response?
Let’s also look at what happens between the end of the request and the beginning of the response.

We can see that the server sends an packet with 0 payload and the ACK bit set. This 0-length ACK is a simple acknowledgement of the incoming request, and the time difference between the end of the request and this ACK is actually the network delay between the client and the server.
The next packet that we see from the server is then full-MSS and is actually the first packet in the response. That means that the time difference between the ACK and this packet is the time the application took to generate the response.
Encrypted Traffic
Now, let’s look at the same traffic, but encrypted.

It’s a little harder to get oriented to it, but we can look for a specific pattern:
- One or more full-MSS packets with no PSH bit set from the client
- A less-than-MSS packet with the PSH bit set from the client
- A zero-payload ACK from the server
- One or more full-MSS packets with no PSH bit set from the server
The first two parts of that sequence are the request. The third part is the network delay. The fourth part is the response.
In this screenshot, we can see the HTTP request in frames 23 and 24, the zero-payload ACK in frame 25, and the beginning of the response in frame 26. Looking at the delta conversation time column, we can see that the network delay in this case is less than 1 ms, and the server delay is 1.6 ms.
Caveats
This is network analysis, so there are always caveats.
This pattern works really well for more traditional protocols, including HTTP 1.1, database traffic, MQ traffic, and other similar protocols.
It breaks with HTTP2 and QUIC. Both of those protocols have multiple application request streams embedded within the encrypted connection, so there’s really no way to tell when a request starts and stops without decrypted the traffic. QUIC also pads packets to make them full-MTU (QUIC is UDP, so it doesn’t have a negotiated MSS), further obscuring those requests and responses.
If you need to analyze communication that uses either of those newer protocols, you need to configure either the client or server to downgrade the traffic to HTTP 1.1 in order to perform any useful analysis. And if you have that level of access, you might as well just grab the keys and decrypt the capture.
Summary
We were able to take a close look at decrypted requests and responses in Wireshark to see what makes them distinctive. That gave us the following pattern that also holds for encrypted traffic:
- One or more full-MSS packets with no PSH bit set from the client
- A less-than-MSS packet with the PSH bit set from the client
- A zero-payload ACK from the server
- One or more full-MSS packets with no PSH bit set from the server
This pattern lets us identify requests and responses in encrypted traffic.